OpenClaw and OpenRouter Search Interest Is Falling. Is AI Trust Falling Too?
Google Trends shows cooling interest in OpenClaw and OpenRouter. We separate what the charts show from what they cannot tell us about AI trust.
 AXIOM Team August 11, 2026 9 min read
Search interest in OpenClaw has fallen sharply from its early-2026 peak. OpenRouter, after a smaller rise, is also drifting lower. Put those curves next to searches for OpenAI, Anthropic, and “AI Agents,” and the immediate temptation is to write a sweeping verdict: the agent boom is over, or people no longer trust AI.
The charts do not support either conclusion on their own.
They do show something worth examining: the first wave of curiosity around particular AI products is cooling, while interest in the broader agent category is behaving differently. That gap may tell us less about whether AI matters and more about how the market is maturing—from discovery and spectacle toward habitual use, embedded infrastructure, and harder questions about security, cost, and control.
First, What the Graphs Actually Measure
Both supplied charts show worldwide Google Web Search interest over the past year. Every comparison uses a search term, not a Google Trends topic. That distinction matters: Google says a search term measures the exact words entered, whereas a topic can group related wording, languages, and spellings. Searches for “Open Claw,” a project URL, a model name, or a feature may not be counted under the exact term openclaw.
Google Trends also does not report absolute search volume. Google normalizes each data point relative to all searches in that geography and time period, then scales the result from 0 to 100. A score of 100 means the highest relative point in this comparison—not 100 searches, 100 percent market share, or a fixed quantity that can be compared with a different Trends export.
So the graphs are best read as an attention signal. They do not directly measure:
- active users, API calls, revenue, retention, or production deployments;
- positive versus negative sentiment;
- confidence in model outputs or willingness to delegate work; or
- searches conducted inside GitHub, app stores, social networks, documentation sites, or AI assistants.
Google itself cautions that Trends is not polling data and should be treated as one data point among others. That is the right standard here.
Graph One: A Breakout, a Peak, and a Long Normalization
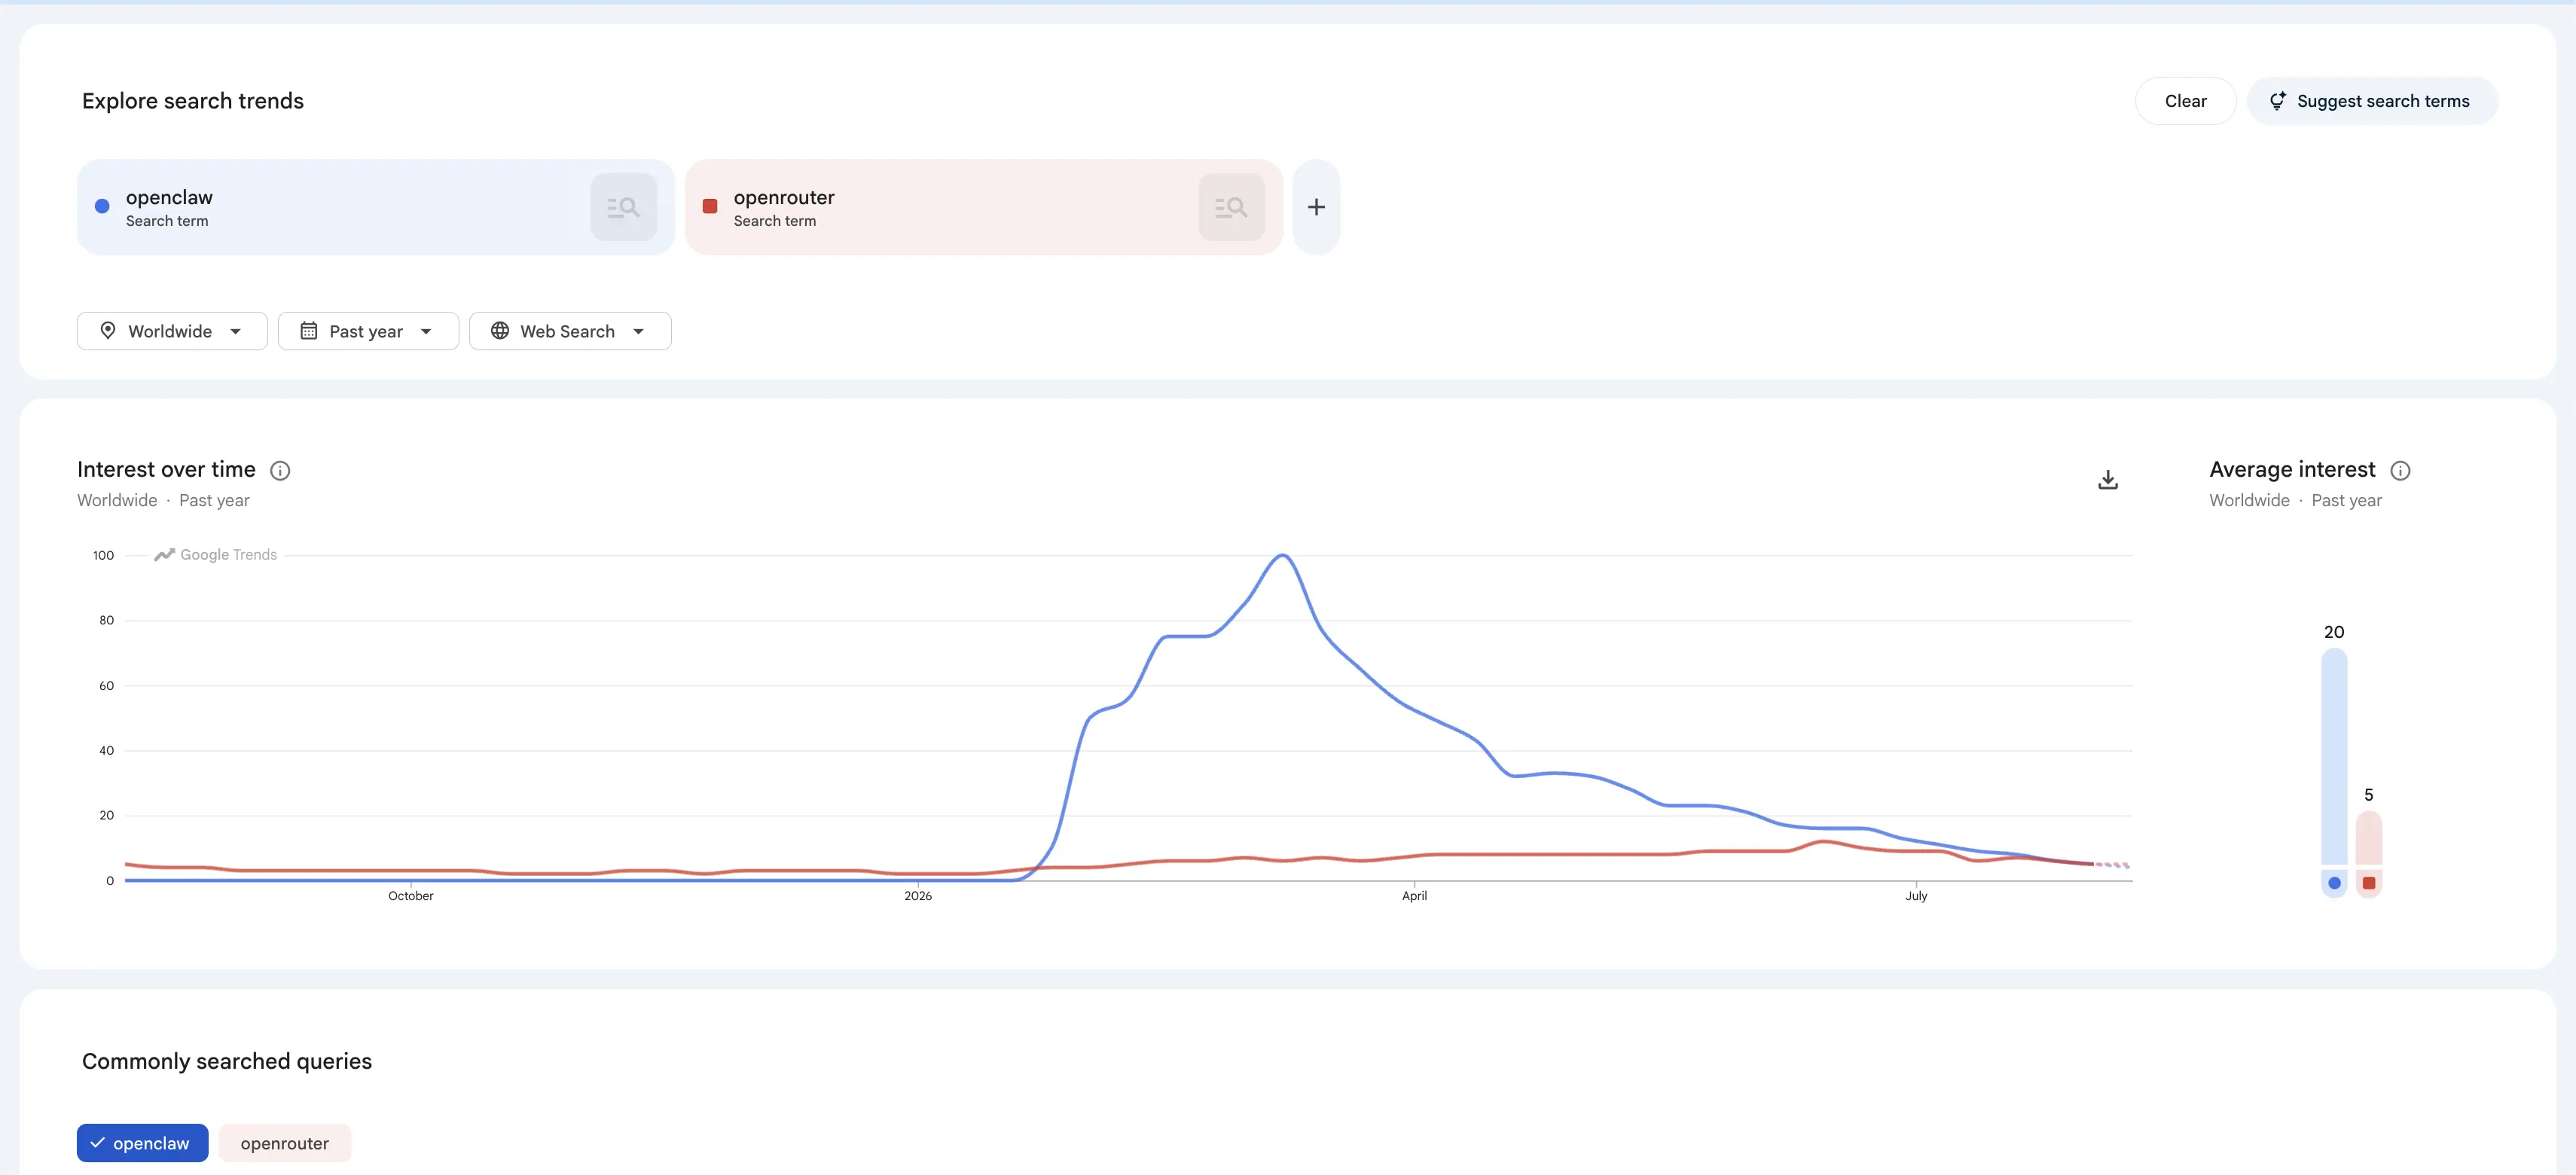
The first graph compares openclaw with openrouter.
OpenClaw is the unmistakable event. Interest sits near zero through the first part of the window, rises rapidly in early 2026, reaches the chart’s normalized peak of 100, and then declines for months. By the end of the observed period, the line is back in single digits. Its average interest remains well above OpenRouter—20 versus 5—because the launch wave was so large.
OpenRouter follows a different shape. It begins with low but visible interest, climbs gradually through the middle of the period, briefly reaches the low teens, and then eases back. There is no comparable breakout spike. The line looks more like attention around a developer utility than a mass-market moment.
Three observations follow directly from the chart:
- OpenClaw’s decline is real relative to its own peak. The fall is too sustained to describe as a one-week fluctuation.
- The peak was exceptional, not the baseline. Comparing every later week with 100 can make durable residual interest look like failure.
- The two products did not travel together. OpenClaw’s surge dwarfed OpenRouter’s movement, which argues against a single shared demand curve for all agent infrastructure.
What the graph cannot tell us is whether early searchers became active users, abandoned the product, learned to navigate directly, or simply stopped needing introductory information.
The Wider Comparison Changes the Story
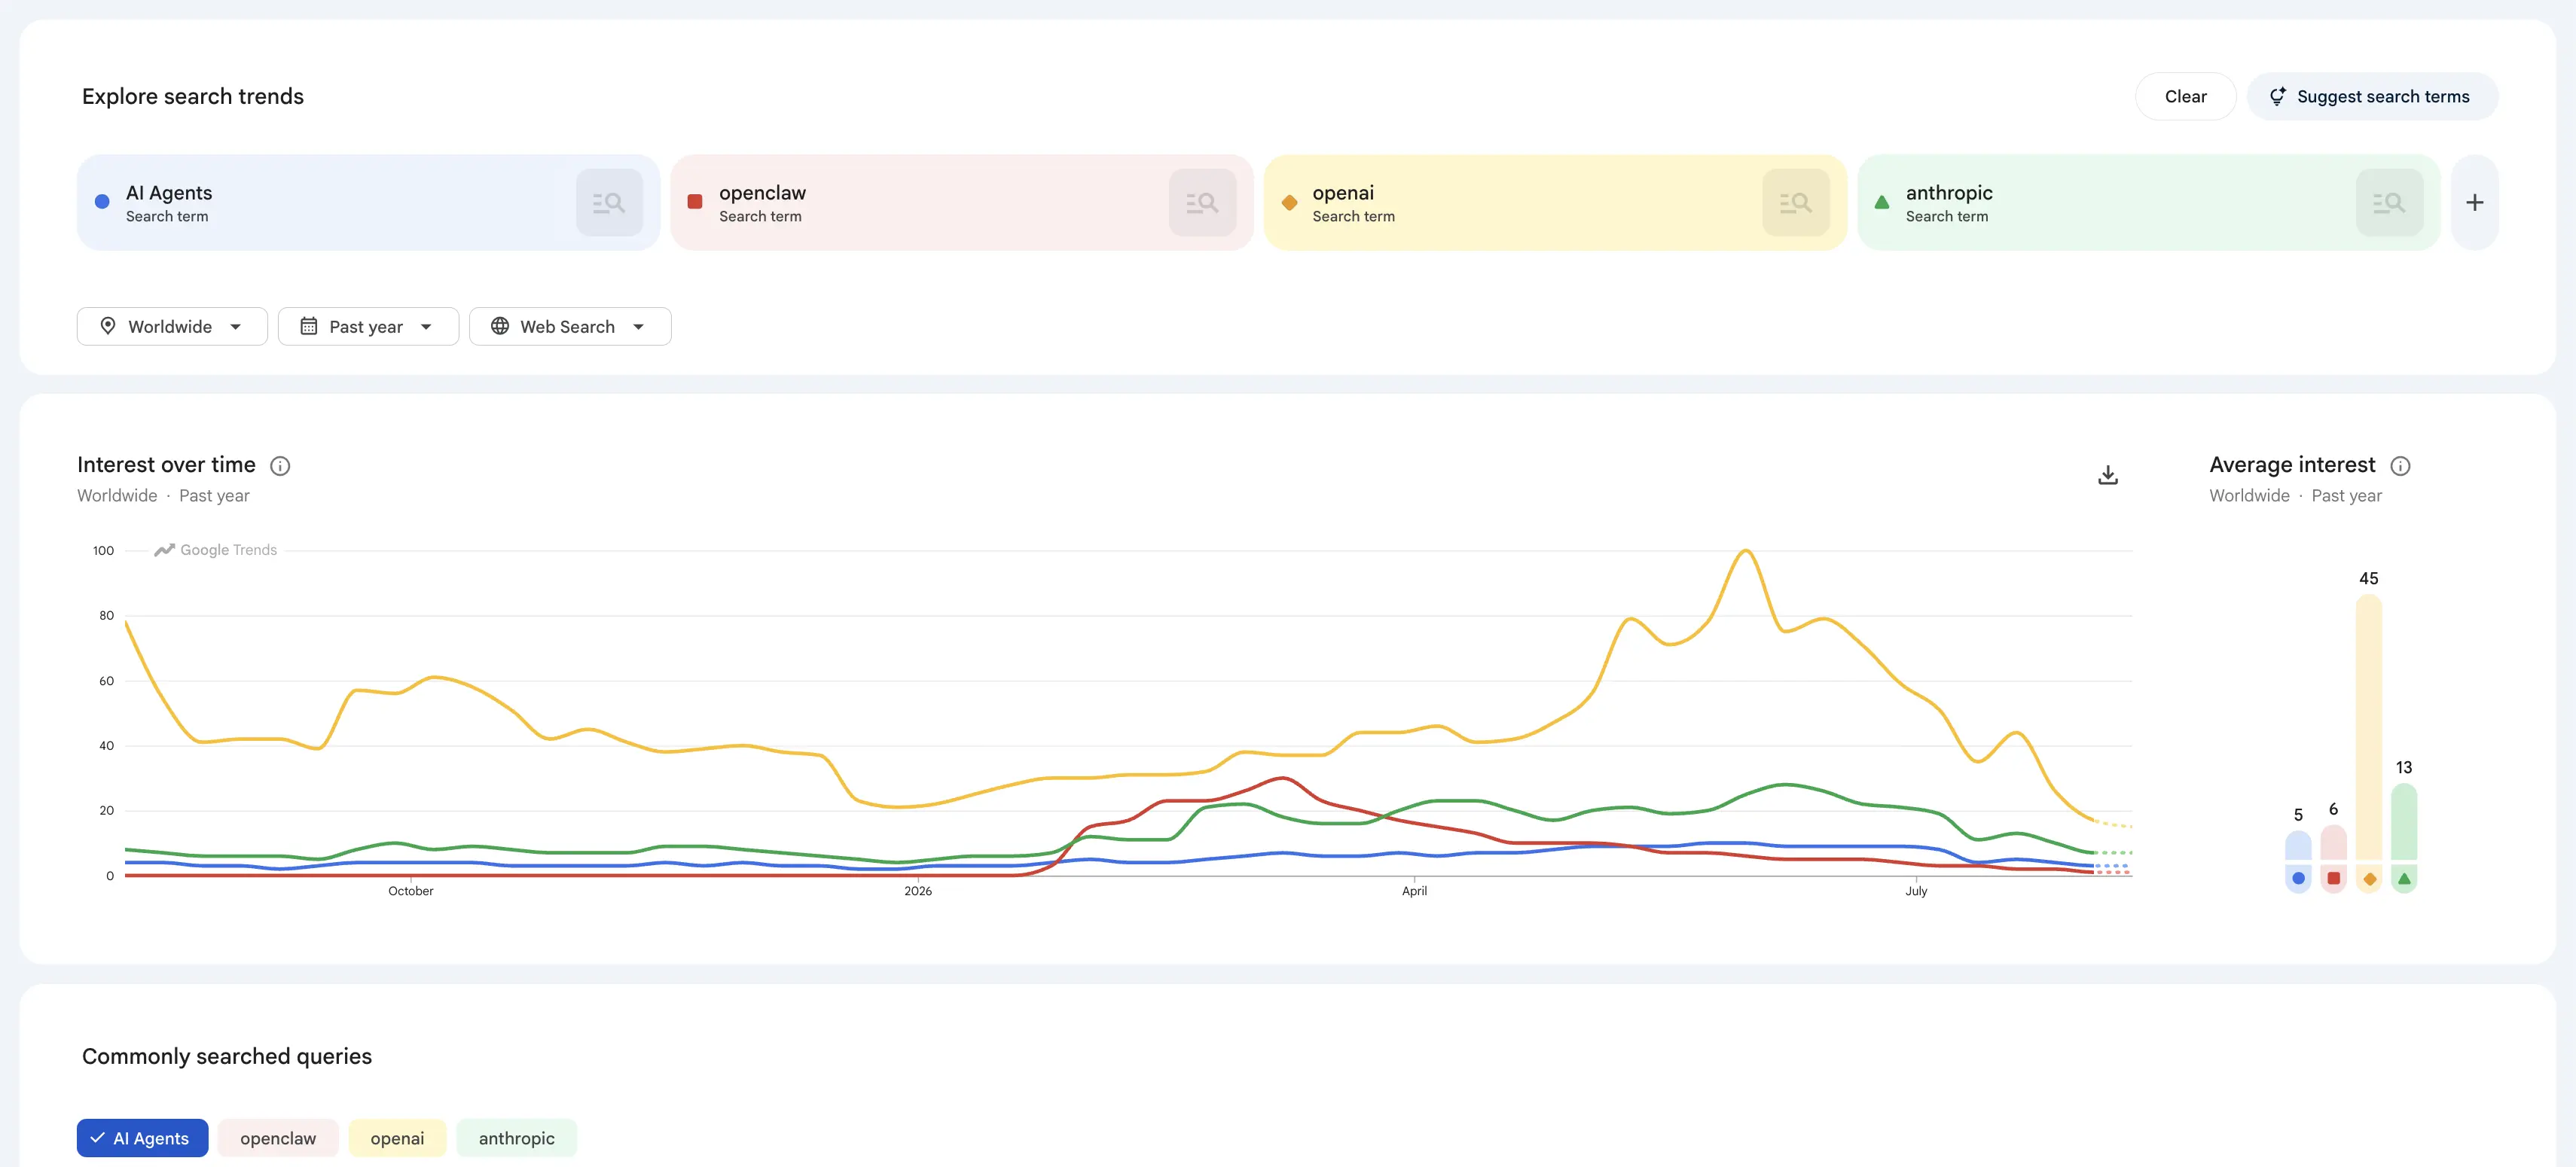
The second graph adds the exact terms AI Agents, openai, and anthropic.
OpenAI holds the highest average interest at 45 and produces several large peaks, including the comparison-wide high of 100. Anthropic averages 13 and maintains a lower but more persistent curve. OpenClaw averages 6 in this four-term comparison, while “AI Agents” averages 5.
All four lines soften near the end of the period, but they do not soften in the same way. OpenAI and Anthropic retain more interest than OpenClaw. The “AI Agents” line is comparatively flat for most of the year, with only a modest late decline. OpenClaw, by contrast, behaves like a named-product launch: a fast rise, a clear apex, and a long decay.
That distinction weakens the claim that the public has rejected agents as a category. If broad category interest had collapsed in lockstep with OpenClaw, the “AI winter” reading would be stronger. Instead, the chart is consistent with a more ordinary technology cycle: a breakout brand loses novelty while the underlying category remains present.
There is another limitation. Comparing four terms rescales the graph around the largest point in that particular set. OpenClaw’s peak is therefore shown at roughly 30 rather than 100. Its underlying relative-search series has not changed; the comparison scale has. The first chart is better for seeing OpenClaw’s rise and fall in detail. The second is better for judging its size beside larger AI brands.
Five Plausible Reasons Interest Is Declining
The following explanations are hypotheses, not findings from the graphs. Several can be true at once.
1. Novelty Decay
Breakout developer products often generate a concentrated search wave: announcements, explainers, installation guides, security reactions, and “what is it?” queries all arrive together. Once the market understands the product, that discovery demand falls. A lower search index can coexist with a larger installed base.
This is the simplest explanation for OpenClaw’s shape. It should be the default hypothesis until retention, download, repository, or usage data says otherwise.
2. Navigation Moves Away From Google
People search less when they know where to go. Existing users may open documentation from bookmarks, work in a CLI, follow GitHub releases, or interact with the product directly. OpenRouter is explicitly a unified API for accessing and routing across models, according to its official quickstart. Mature API use happens in applications and build systems, not in repeated Google searches.
This effect is especially relevant to infrastructure products. Search is useful during evaluation; telemetry and billing dashboards matter after integration.
3. Attention Fragments Across Brands, Models, and Features
The AI market produces new model names, agent frameworks, coding tools, and interfaces every week. Search attention can move from a platform name to a specific model, skill, integration, or competitor without reducing total AI activity. Exact-term Trends charts are poorly suited to capturing that fragmented long tail.
The implication is not that brand interest is meaningless. It is that brand interest is only one layer of the demand map.
4. The Evaluation Bar Is Rising
The first phase of agent adoption rewarded capability: can this system take action? The next phase asks whether it can take action safely, predictably, and economically.
OpenClaw’s own security guidance describes a personal-assistant trust model and says a shared gateway is not a security boundary for mutually untrusted users. That does not make the product untrustworthy. It defines an operating boundary that teams must understand. For enterprises, questions about credentials, tools, audit trails, sandboxing, and human approval can lengthen evaluation cycles even while technical interest remains high.
This is why an MCP Gateway and an AI Gateway become more relevant as agents move beyond experiments: the value shifts from merely connecting models and tools to governing who can do what, with which data, under which policy.
5. The Market Is Moving From Products to Embedded Capabilities
Agent behavior is increasingly becoming a feature inside IDEs, support systems, productivity suites, and internal workflows. Users may benefit from agents without searching for “AI Agents” or the orchestration layer underneath them.
That is a familiar pattern in infrastructure. Search interest in a component can flatten precisely because the component has become an implementation detail.
Is Trust in AI Waning?
Possibly—but these graphs are not evidence of it.
Trust has at least three layers:
- capability trust: will the model produce a useful answer?
- operational trust: will the agent act reliably and recover safely when it fails?
- institutional trust: will the provider handle data, policy, pricing, and accountability as promised?
A search decline cannot distinguish among them. Someone searching less for OpenClaw might have stopped using it after a bad experience. They might also be a satisfied daily user who no longer needs Google. Someone searching for security guidance might be skeptical, or they might be preparing a serious deployment.
If trust were the research question, better evidence would combine retention, task-success rates, override frequency, incident reports, security-review outcomes, willingness to grant permissions, and surveys that ask directly about confidence. Search data can identify when to investigate; it cannot supply the diagnosis.
The stronger interpretation is that unconditional trust is waning while conditional adoption is growing. Buyers are less impressed by a dramatic demo and more interested in verification, scoped permissions, observability, and rollback. That is not rejection. It is a maturing risk model.
Technology-Specific Correction or Market-Wide Cooling?
The available evidence points to both, at different strengths.
The steepness of OpenClaw’s descent looks technology-specific because its rise was also technology-specific. OpenRouter’s shallower curve suggests a smaller correction. Meanwhile, the late declines in OpenAI and Anthropic suggest some broader cooling in search attention across named AI brands. The relatively stable “AI Agents” term argues against a category-wide collapse.
The most defensible conclusion is therefore:
Public search attention is cooling across several AI names, but OpenClaw’s decline is amplified by an exceptional launch cycle. The charts do not show that agent adoption—or trust in AI as a whole—is collapsing.
For teams making platform decisions, the practical response is not to chase whichever line is highest this month. It is to measure what search interest cannot: completed tasks, reliability, unit economics, policy violations, human overrides, and business outcomes. A governed LLM Gateway can make model and provider traffic observable, while VibeFlow applies the same evidence-first discipline to AI-assisted software delivery.
What to Watch Next
Over the next two quarters, four signals would help distinguish normalization from structural retreat:
- whether OpenClaw search interest establishes a stable floor or continues toward zero;
- whether OpenRouter rises around major model releases, indicating event-driven infrastructure demand;
- whether broad agent terminology holds steady while individual brands rotate; and
- whether usage, developer activity, and enterprise deployment evidence diverge from search attention.
The last signal matters most. Technology markets often become less searchable as they become more operational. If the tools are moving from headlines into workflows, a quieter graph may be a sign of maturation. If usage and retention fall with it, the story is contraction. Until those datasets are paired, “attention is normalizing” is more accurate than either “AI trust is collapsing” or “nothing has changed.”
Written by
AXIOM Team