OpenTelemetry for LLMs: How the Axiom LLM Gateway Ships Audit-Grade Traces
OpenTelemetry's GenAI semantic conventions made LLM telemetry portable. The hard part is producing them consistently across every vendor — which is what an LLM gateway is for.
If you have ever tried to answer the question “what did our LLM cost last month, by team, by model, with the prompts attached?” from raw vendor invoices and SDK logs, you already know the shape of the problem this post is about. Each provider emits its own format. Each SDK logs at its own level. Costs only appear after the fact. The trace of what actually happened — user input, retrieved context, model response, tool calls, downstream effects — is scattered across application logs, vendor dashboards, and whatever your team manually correlated.
OpenTelemetry (OTEL) is the answer the broader observability community converged on for non-AI distributed systems, and as of 2024-2025 the OTEL community shipped GenAI semantic conventions that extend the standard to LLM workloads. The hard part is no longer “what attributes should I record on a model call?” The conventions answer that. The hard part is now “how do I produce these attributes consistently across OpenAI, Anthropic, Gemini, Mistral, Bedrock, and our self-hosted models without writing per-vendor instrumentation code in every service?”
That is the problem an LLM gateway is built to solve. This post walks through the OTEL GenAI conventions, why SDK-level instrumentation is not enough on its own, what an LLM gateway adds, and how the Axiom LLM Gateway emits OTEL traces and metrics that satisfy both an SRE’s observability needs and a compliance reviewer’s evidence requirements.
For a broader treatment of AI observability beyond OTEL, see the /learn/what-is-ai-observability explainer.
A 90-Second OTEL Primer
OpenTelemetry produces three signal types:
- Traces — per-request causal chains made of spans. A span has a name, a start and end time, attributes (key-value pairs), events, and links to other spans. Spans nest into parent-child relationships to capture causality.
- Metrics — aggregated numerical measurements, with names, units, attributes, and an aggregation type (counter, gauge, histogram).
- Logs — structured log records, optionally correlated to a span ID and trace ID.
All three flow through the same wire protocol (OTLP) to the same destinations. The destination is intentionally not opinionated — OTEL ships with the OpenTelemetry Collector that can fan signals out to Jaeger, Honeycomb, Datadog, Grafana Tempo, AWS X-Ray, Splunk, or any other OTLP-compatible backend without changing the application code that produced them.
For LLM workloads, the trace is the load-bearing signal. Metrics give you the SRE-style aggregations (p50/p99 latency, error rate, throughput, tokens-per-second). Logs are useful but secondary. The reason traces dominate is that an LLM call is rarely a single operation — it is a chain: retrieve context, call a model, optionally call a tool, optionally call the model again with the tool result, return. That entire chain belongs in one trace tree.
The GenAI Semantic Conventions
OTEL semantic conventions are the standardized attribute names that make telemetry portable across vendors and tools. For LLMs, the relevant attributes were stabilized under the GenAI Spans spec and the companion GenAI Metrics spec.
The attributes that show up on every well-instrumented LLM call:
gen_ai.system— the AI provider (openai,anthropic,gemini,bedrock, etc).gen_ai.request.model— the model the caller asked for (e.g.claude-opus-4-7).gen_ai.response.model— the model that actually served the response (often the same, sometimes different after auto-failover).gen_ai.usage.input_tokensandgen_ai.usage.output_tokens— token counts.gen_ai.request.temperature,gen_ai.request.top_p,gen_ai.request.max_tokens— sampling parameters.gen_ai.response.finish_reasons— why the model stopped (stop,length,tool_calls,content_filter).gen_ai.operation.name— the operation type (chat,text_completion,embeddings).
The metrics half mirrors the spans:
gen_ai.client.token.usage— histogram of token usage per call.gen_ai.client.operation.duration— histogram of call latency.gen_ai.server.request.duration— server-side latency for self-hosted serving.
These names are not vendor opinions. They are standardized so that a Honeycomb dashboard built against gen_ai.usage.output_tokens works whether the calls came from OpenAI, Anthropic, or your self-hosted Llama. That portability is the whole point.
Why SDK-Level Instrumentation Is Not Enough
The naive answer to “how do I get OTEL telemetry from my LLM calls” is to use one of the auto-instrumentation packages (e.g. opentelemetry-instrumentation-openai, opentelemetry-instrumentation-anthropic). They work. They produce traces. They emit the right semantic conventions. For a single-app, single-vendor demo, that is enough.
For a real enterprise stack it is not, for four reasons:
- Coverage is uneven across vendors and SDK versions. Each instrumentation package is maintained by a different community. Some lag the underlying SDK by a release. Some skip features (streaming responses, tool calls, multimodal) that you need.
- Coverage is uneven across services and languages. Your Python data-science notebook calling OpenAI is instrumented; your Go service calling Anthropic is instrumented separately, with different code, in a different repo. The chance every team in a 50-engineer org instruments correctly is, generously, zero.
- Cost telemetry is not a side-effect. Token counts come back from each vendor in different field names with different unit conventions. Normalizing them into
gen_ai.usage.*is per-vendor adapter work. Cost-per-token is not in the SDK at all — it is a separate lookup against a vendor pricing table that has to live somewhere. - Policy enforcement does not exist at the SDK layer. SDKs call the model. They do not gate the call on a content filter, redact PII before egress, or refuse based on a per-team budget. Anything you want to add at the boundary — including the structured audit log compliance asks for — has to live somewhere outside the SDK.
The right place for that “somewhere outside the SDK” is a gateway.
What an LLM Gateway Adds
An LLM gateway is a service that sits between your applications and the model providers. Every model call from every service in the org flows through it. The gateway is not a model; it is a policy + observability point.
The four things it adds for telemetry:
- A single egress point. Every LLM call in the org passes through one piece of code that knows how to instrument it. Vendor coverage gets fixed once; downstream services do nothing.
- A normalized server-side span per call. Each request creates a single OTEL span with the full set of
gen_ai.*attributes set correctly, regardless of which vendor handled it. - Centralized cost rollup. The gateway knows which model handled the call and the per-token rates; it computes cost as a side-effect and emits it alongside the token counts.
- Unified retention and routing. One OTLP collector configuration. One retention policy. One destination map. SREs configure where traces go without touching application code.
Gateways are not a new pattern — they are the same idea as an API gateway, an ingress controller, or a service mesh egress proxy, narrowed to LLM traffic. The novelty in 2024-2026 is that they have become the standard place for the OTEL-shaped audit trail compliance reviewers ask for.
How the Axiom LLM Gateway Emits OTEL
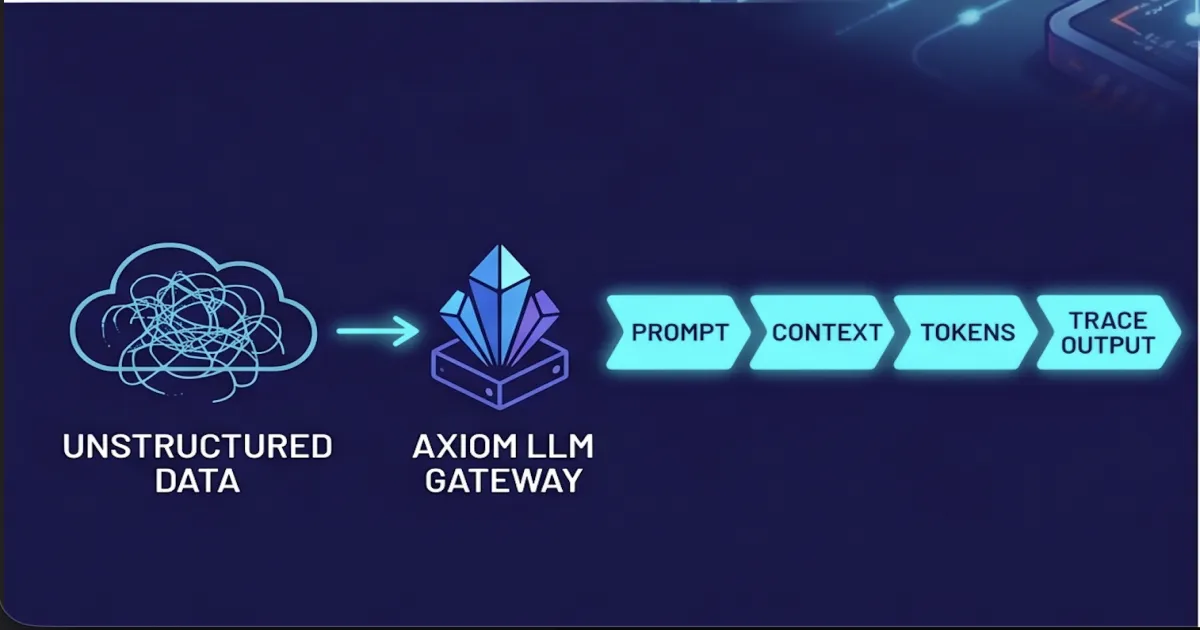
The Axiom LLM Gateway is one implementation of this pattern. Every request to the gateway becomes a server-side span with the full GenAI attribute set. Tool calls and downstream agent steps become child spans linked to the request span. Token counts, latency percentiles, and error codes flow as OTEL metrics. Output is OTLP, which means it ships to whatever backend your platform team already runs.
The flow looks like this:
flowchart LR
    A[Application/Agent] -->|HTTPS| B[Axiom LLM Gateway]
    B -->|provider call| C[Model Provider]
    B -->|OTLP traces| D[OTEL Collector]
    B -->|OTLP metrics| D
    D -->|exporter| E1[Jaeger or Tempo]
    D -->|exporter| E2[Honeycomb]
    D -->|exporter| E3[Datadog]
    D -->|exporter| E4[Splunk or others]
The gateway speaks OTLP directly so an OTEL Collector is optional — it is the recommended deployment because the Collector is where you do sampling, redaction, and per-environment routing, but the gateway itself does not require one.
For a worked example, consider a single agent task: an application calls the gateway with a prompt, the gateway calls the model, the model decides to invoke a tool, the gateway calls the tool, the tool returns, the gateway calls the model again with the tool result, and the model returns the final response. That entire chain is one trace with parent and child spans:
sequenceDiagram
    autonumber
    participant App as Application
    participant GW as Axiom LLM Gateway
    participant LLM as Model Provider
    participant Tool as MCP Tool
    App->>GW: chat.completion (request span starts)
    GW->>LLM: provider call (child span)
    LLM-->>GW: response with tool_call
    GW->>Tool: invoke tool (child span)
    Tool-->>GW: tool result
    GW->>LLM: continue with tool result (child span)
    LLM-->>GW: final response
    GW-->>App: chat.completion response (request span closes)
Every span in that diagram carries the OTEL GenAI attributes the spec defines. The root span has gen_ai.operation.name=chat, the model child spans carry gen_ai.system, gen_ai.request.model, and the token usage attributes, and the tool child spans carry gen_ai.tool.name plus the tool input/output (subject to the redaction policy you configured).
The result is that an SRE asking “why did the p99 spike at 14:02?” and a compliance reviewer asking “show me the prompt and response for transaction abc-123” both query the same trace store with different filters. The shape of the data is the same.
Evidence-Quality for Compliance
OTEL traces from a gateway are not just a nice-to-have for SRE; they are the load-bearing artifact for AI compliance frameworks.
- SOC 2 CC7.2 expects you to detect and respond to anomalies, with evidence. A trace store with one normalized span per LLM call — the
gen_ai.system, the prompt hash, the response timing, the cost — is what “evidence” looks like. - ISO 27001 A.12.4 (event logging) and A.16 (incident management) expect evidence of system events sufficient to reconstruct an incident. OTEL traces, paired with prompt and model versioning, satisfy that requirement for AI systems.
- EU AI Act Article 12 requires automatic recording of events for high-risk AI systems sufficient to ensure post-hoc traceability. The GenAI span set is a clean fit.
The point is not that OTEL is a compliance product — it is not. The point is that OTEL traces from a gateway are the cheapest path to the artifact every framework asks for, because you produce them as a side-effect of running the system at all.
What This Looks Like Day to Day
A platform team adopting this pattern typically goes through three stages.
Stage 1 — route through the gateway. Change application code to point at the gateway URL instead of the vendor URL. This is usually a one-line environment variable change because the gateway is provider-API-compatible. From this moment, every LLM call is captured as an OTEL span and a metric.
Stage 2 — configure the OTEL Collector. Drop a Collector in front of the gateway with exporters to wherever your existing observability stack lives (Datadog, Honeycomb, Tempo, etc). Tune sampling and redaction in the Collector, not in application code. Over the first few weeks, build dashboards on the gen_ai.* metrics for cost, latency, and error rate per team and per model.
Stage 3 — treat the trace store as the audit system. Once a complete trace exists for every LLM call, the compliance use case unlocks: build an evidence query for SOC 2 control testing, surface high-risk model interactions to the security team, prove on demand which prompts and responses any given user saw. This is not a separate system; it is queries against the trace store you already have.
The reason gateways are the right place for this is that gates are easy to retrofit and SDKs are not. You can adopt the pattern incrementally — one app at a time — without rewriting any application logic. By the time the first compliance audit asks, the audit trail has been accumulating for months.
The Take
OpenTelemetry’s GenAI semantic conventions made LLM telemetry portable. They did not make it easy to produce. The instrumentation problem — getting consistent attributes across every vendor and every service — is what an LLM gateway exists to solve.
The pattern is mature enough now that “route LLM traffic through a gateway” should be the default architectural decision in any enterprise AI program. Cost, observability, governance, and compliance evidence all become side-effects of routing instead of separate engineering projects. The cheapest evidence is the evidence you collect by accident.
Pick a gateway. Wire OTLP to whatever backend you already run. Build dashboards on the GenAI metrics. The rest of the AI program gets simpler.
Written by
AXIOM Team